


OO님, 서버 응답이 예전보다 느려진것 같아요, 확인좀 해주세요.
확인해보겠습니다. 선택지는 파이썬 프로파일러 관련 검색을 해보고 4개로 추려봅니다. 혹시 다른 방법이 있다면 알려주시길 부탁드립니다.
1.
print(time)
2.
cProfiler
3.
line_profiler
4.
yappi
24-10-24 추가
새로운 툴을 찾았습니다.
•
async 코드 지원
•
어디서 병목걸리는지 찾아가기가 아주 편함
•
리퀘스트별로 따로 분석할 수 있음
print 찍어보기
쉽고, 단순하고, 직관의 방법 입니다.
decorator: 함수별 소요 시간 출력
일단 어느 함수가 어느 정도 걸리는지 잡아봅니다.
from functools import wraps
def async_benchmark(func):
"""A decorator to benchmark the execution time of async func."""
@wraps(func)
async def wrapper(*args, **kwargs):
start_time = time.time()
result = await func(*args, **kwargs)
end_time = time.time()
execution_time = end_time - start_time
print(f"{func.__name__} took {execution_time:.4f} seconds to run.")
return result
return wrapper
@async_benchmark
async def func_a(...):
...
Python
복사
오래걸리는 라인 파악하기 by print
해당 함수에서 방해 요소가 무엇인지 파악해봅니다.
import time
async def func_b(...):
st = time.time()
...
print(f"point 1 : {time.time() - st}")
...
print(f"point 2 : {time.time() - st}")
...
print(f"point 3 : {time.time() - st}")
...
return ...
Python
복사
이 방법은 다른 라이브러리의 외부 인터페이스 소요시간만을 알수 있기에 외부 라이브러리의 탓만 하다 끝날 수 있습니다.
cProfile
파이썬 내장 프로파일러인 cProfile을 사용합니다.
# https://docs.sqlalchemy.org/en/20/faq/performance.html#code-profiling
import asyncio
import cProfile
import io
import pstats
import contextlib
import time
@contextlib.contextmanager
def profiled():
pr = cProfile.Profile()
pr.enable()
yield
pr.disable()
s = io.StringIO()
ps = pstats.Stats(pr, stream=s).sort_stats("time")
ps.print_stats()
# uncomment this to see who's calling what
# ps.print_callers()
print(s.getvalue())
async def simple_timer(n):
st = time.time()
await asyncio.sleep(n)
et = time.time() - st
print(f"sleep takes {et:.3f} seconds")
async def main():
with profiled():
await simple_timer(1)
if __name__ == "__main__":
asyncio.run(main())
Python
복사
sleep takes 1.003 seconds
72 function calls in 1.003 seconds
Ordered by: internal time
ncalls tottime percall cumtime percall filename:lineno(function)
2 1.003 0.501 1.003 0.501 {method 'control' of 'select.kqueue' objects}
1 0.000 0.000 0.000 0.000 {built-in method builtins.print}
2 0.000 0.000 1.003 0.502 /Users/rumbarum/.pyenv/versions/3.11.1/lib/python3.11/asyncio/base_events.py:1842(_run_once)
1 0.000 0.000 0.000 0.000 /Users/rumbarum/Library/Application Support/JetBrains/PyCharmCE2023.1/scratches/scratch_8.py:28(main)
2 0.000 0.000 0.000 0.000 /Users/rumbarum/Library/Application Support/JetBrains/PyCharmCE2023.1/scratches/scratch_8.py:22(simple_timer)
1 0.000 0.000 0.000 0.000 /Users/rumbarum/Library/Application Support/JetBrains/PyCharmCE2023.1/scratches/scratch_8.py:9(profiled)
2 0.000 0.000 0.000 0.000 /Users/rumbarum/.pyenv/versions/3.11.1/lib/python3.11/asyncio/tasks.py:627(sleep)
2 0.000 0.000 1.003 0.501 /Users/rumbarum/.pyenv/versions/3.11.1/lib/python3.11/selectors.py:553(select)
1 0.000 0.000 0.000 0.000 /Users/rumbarum/.pyenv/versions/3.11.1/lib/python3.11/asyncio/events.py:147(cancel)
2 0.000 0.000 0.000 0.000 /Users/rumbarum/.pyenv/versions/3.11.1/lib/python3.11/asyncio/events.py:31(__init__)
2 0.000 0.000 0.000 0.000 /Users/rumbarum/.pyenv/versions/3.11.1/lib/python3.11/asyncio/events.py:78(_run)
1 0.000 0.000 0.000 0.000 /Users/rumbarum/.pyenv/versions/3.11.1/lib/python3.11/asyncio/base_events.py:733(call_at)
1 0.000 0.000 0.000 0.000 /Users/rumbarum/.pyenv/versions/3.11.1/lib/python3.11/asyncio/futures.py:311(_set_result_unless_cancelled)
2 0.000 0.000 0.000 0.000 {method 'run' of '_contextvars.Context' objects}
... 이하 생략
Python
복사
cProfile을 사용해도 asynchronous 동작 시간을 못 잡습니다.
Line-Profiler
line_profiler를 설치합니다.
pip install line_profiler
Python
복사
async 동작을 시험하기 위한 테스트코드를 작성합니다.
from line_profiler import LineProfiler
import time
import asyncio
profile = LineProfiler()
async def simple_timer(n):
st = time.time()
await asyncio.sleep(n)
et = time.time() - st
print(f"sleep takes {et:.3f} seconds")
wrapped_func = profile(simple_timer)
asyncio.run(wrapped_func(1))
# ms로 기준 시간을 세팅합니다.
profile.print_stats(output_unit=1e-03)
Python
복사
# Result
sleep takes 1.005 seconds
Timer unit: 0.001 s
Total time: 0.000123 s
File: /Users/rumbarum/Library/Application Support/JetBrains/PyCharmCE2023.1/scratches/scratch_6.py
Function: simple_timer at line 8
Line # Hits Time Per Hit % Time Line Contents
==============================================================
8 async def simple_timer(n):
9 1 0.0 0.0 1.6 st = time.time()
10 1 0.1 0.1 46.3 await asyncio.sleep(n)
11 1 0.0 0.0 3.3 et = time.time() - st
12 1 0.1 0.1 48.8 print(f"sleep takes {et:.3f} seconds")
Python
복사
simple_timer 동작은 1초가 걸렸는데, Line Profiler로는 Total time: 0.000123 s 로 나옵니다.
asyncio.sleep(n) 을 time.sleep(n)으로 바꿔야 기대한 대로 동작이 됩니다.
sleep takes 1.003 seconds
Timer unit: 0.001 s
Total time: 1.00341 s
File: /Users/rumbarum/Library/Application Support/JetBrains/PyCharmCE2023.1/scratches/scratch_6.py
Function: simple_timer at line 7
Line # Hits Time Per Hit % Time Line Contents
==============================================================
7 async def simple_timer(n):
8 1 0.0 0.0 0.0 st = time.time()
9 # await asyncio.sleep(n)
10 1 1003.3 1003.3 100.0 time.sleep(n)
11 1 0.0 0.0 0.0 et = time.time() - st
12 1 0.1 0.1 0.0 print(f"sleep takes {et:.3f} seconds")
Python
복사
깃헙레포를 찾아보니 이슈가 등록되고 닫혀 있습니다.
async 함수의 동작 시간은 그 안에서 측정 하는것이다. 호출 하는 시간만 측정하고 line_profiler에서 측정하는 것이 아니다는 걸로 이슈가 종결되었습니다.

FastAPI 프로파일러로는 적합하지 않습니다.
yappi
깃헙소개글에 v1.2 부터 coroutine 을 제대로 측정할 수 있다고 안내하고 있습니다. (현재 v1.4)
프로파일러 lib yappi 와 시각화 lib snakeviz 를 설치 합니다.
pip install yappi snakeviz
Shell
복사
async 함수의 동작시간을 감지하는지 확인합니다.
import time
import asyncio
import yappi
async def simple_timer(n):
st = time.time()
await asyncio.sleep(n)
et = time.time() - st
print(f"sleep takes {et:.3f} seconds")
yappi.set_clock_type("WALL")
if __name__ == "__main__":
with yappi.run():
asyncio.run(simple_timer(1))
yappi.get_func_stats().print_all()
Python
복사

* 주의 set_clock_type 을 ‘WALL’ 로 해야만 합니다. (default = ‘cpu’)
** walltime은 실제 동작하지 않은 시간도 포함되기 때문에 감안하고 읽으셔야 합니다. (tsub과 ttot를 비교하시면 됩니다.)
진행 결과입니다. `..atches/scratch_6.py:6 simple_timer` 에서 simple_timer 의 동작시간 잡아냄을 확인 할 수 있습니다.
sleep takes 1.004 seconds
Clock type: WALL
Ordered by: totaltime, desc
name ncall tsub ttot tavg
..hon3.11/asyncio/runners.py:160 run 1 0.000030 1.005664 1.005664
..1/asyncio/runners.py:86 Runner.run 1 0.000032 1.004353 1.004353
..lectorEventLoop.run_until_complete 3 0.000047 1.004269 0.334756
.._UnixSelectorEventLoop.run_forever 3 0.000049 1.004147 0.334716
..2 _UnixSelectorEventLoop._run_once 8 0.000116 1.004071 0.125509
🟠..atches/scratch_6.py:6 simple_timer 1 0.000068 1.003748 1.003748
..hon3.11/asyncio/tasks.py:627 sleep 1 1.003596 1.003646 1.003646
..ctors.py:553 KqueueSelector.select 8 0.000034 1.003579 0.125447
..ncio/runners.py:62 Runner.__exit__ 1 0.000023 0.000747 0.000747
..asyncio/runners.py:65 Runner.close 1 0.000017 0.000723 0.000723
Python
복사
FastAPI 에 적용하기
contextmanager를 사용해 with context 함수를 작성합니다.
import contextlib
import yappi
@contextlib.contextmanager
def yappi_context():
yappi.set_clock_type("WALL")
yappi.start()
yield
yappi.stop()
yappi.get_func_stats().print_all()
yappi.get_func_stats().save("callgrind.prof", "pstat")
print("saved!")
Python
복사
아래처럼 main 함수 wrapping 을 하게 되면, 서버 띄우고 준비하는 시간을 너무 많이 사용하기 때문에 추적하고 싶은 대상의 시간들이 묻힙니다.
if __name__ == "__main__":
try:
with yappi_context():
uvicorn.run(...)
except:
pass
finally:
# 중간에 종료를 하게 될 경우 yield 뒷 구문이 저장되지 않아서 다시 한번 실행합니다.
yappi.get_func_stats().print_all()
# 아래에서 설명합니다.
yappi.get_func_stats().save("callgrind.prof", "pstat")
Python
복사
따라서 내용을 파악하고 싶은 api 영역에서 감싸는게 나아보입니다.
@some_router.get(...)
async def some_lazy_func(...):
with yappi_context():
...
Python
복사
이렇게 하시면 결과물로 테이블이 콘솔에 뜨는 걸 볼 수 있습니다. 그런데 찾아보기가 불편합니다.
이를 간단한 시각 UI로 풀어주는 라이브러리가 snakeviz 입니다.
snakeviz를 사용한 시각화
yappi의 프로파일 결과를 pstat 프로토콜의 callgrind.prof 파일로 저장 했습니다.
저장한 파일을 snakeviz로 오픈합니다.
snakeviz callgrind.prof
Python
복사
로컬에 서빙 웹서버가 동작하며, 접속 URL 을 안내합니다.
snakeviz web server started on 127.0.0.1:8080; enter Ctrl-C to exit
http://127.0.0.1:8080/snakeviz/...
Python
복사
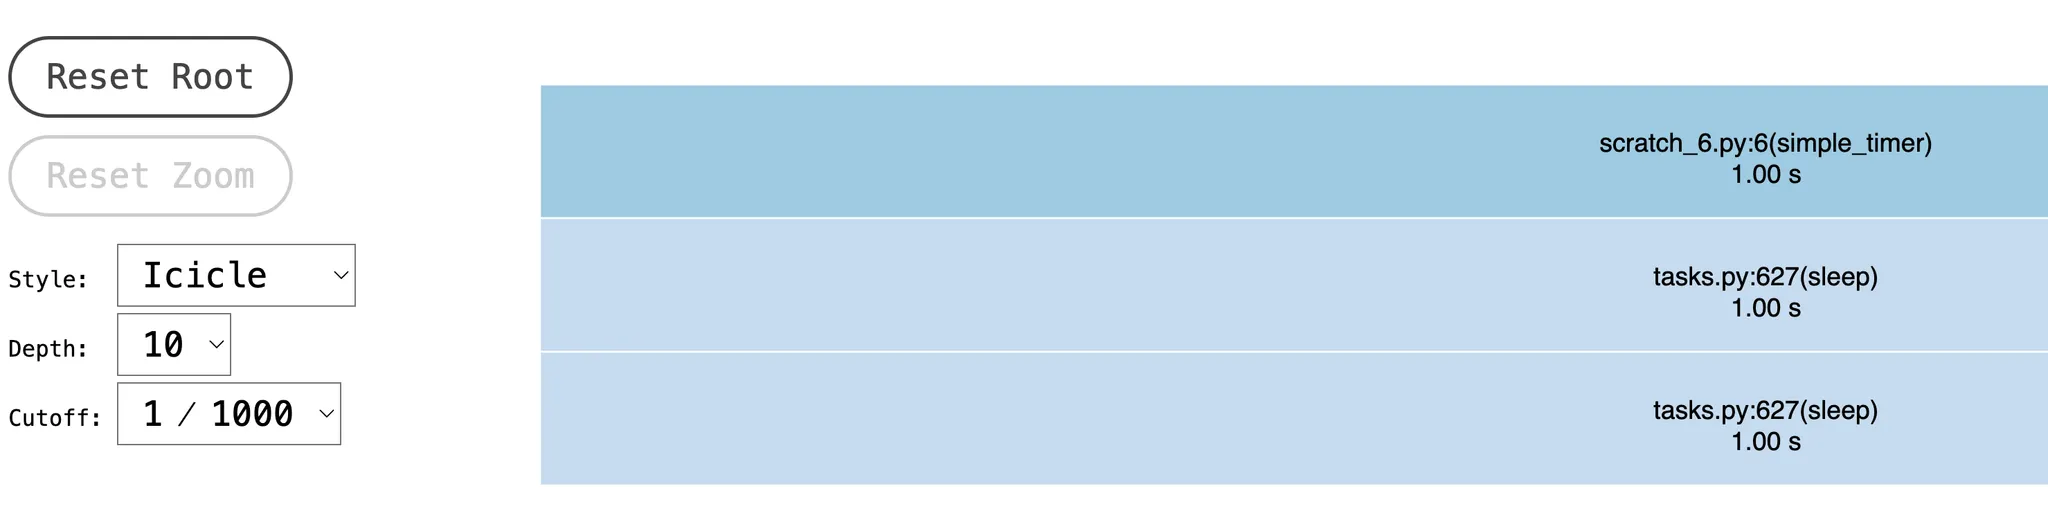
시각화 그래프
간단한 시각화 그래프로 함수들간의 의존성과 시간을 표시합니다. sunburst 형태의 그래프도 지원합니다.
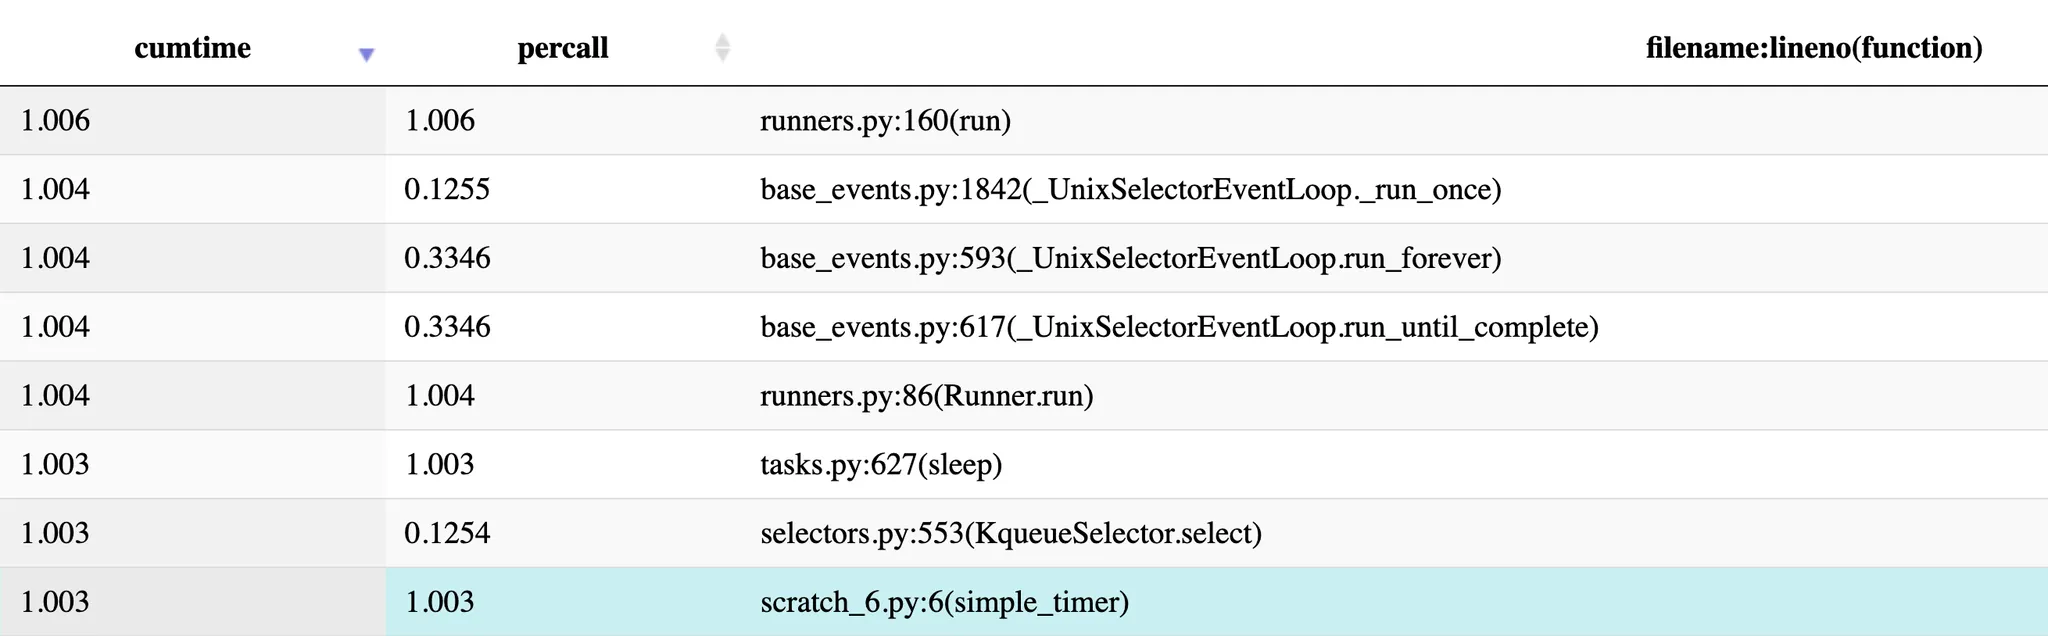
테이블
‘cumtime’을 클릭하여 내림차순 정렬하면 오래걸린 시간 순으로 나열이 됩니다. simple_timer 보다 오래 걸리는 함수들은 simple_timer 를 내포하고 있는 함수라 대기하는 시간이 포함되어서 시간이 길게 찍혔습니다.
스샷에는 보이지 않지만, 파일이름 또는 함수이름을 검색할 수 도 있습니다.
다른 시각화 방법
qcachegrind, pyprof2calltree 를 사용한 call graph 그리기는 아래 문서를 참조해 주세요.
인텔 맥의 경우 qcachegrind 설치에 상당한 시간이 걸릴 수 있습니다. ( 2018 MBP 15, 카탈리나 환경에서 brew로 설치시 9시간 50분 소요 되었습니다.)

서버 동작 확인했습니다.
1.
yappi 가 정답처럼 써놨는데 walltime 기준이라 시간이 혼동됩니다. 주의가 필요합니다.
2.
line_profiler면 다 될 줄 알았는데… async 지원을 해주면 참 좋겠습니다.
3.
이러나 저러나 직접 만들진 않아도 되어서 다행입니다.
Ref.


블로그 메인

